Effectiveness Investigation of The Micro Wind Turbine Installed on An Electric Vehicle as a Range Extender
Wind energy is one of the dominant resources for renewable energy, and it is commonly extracted using conventional wind turbines. It can also be utilized using mini or micro wind turbines on a moving frame, such as an automobile while cruising at high speeds. Thereby self-defeat the purpose of augmenting vehicle performance through utilization of renewable wind energy.
The proposed work aims to generate electricity by utilizing the air flowing around the vehicle through the micro wind turbine without affecting the vehicle's aerodynamic performance. In this case, the electricity produced can be used to charge up the battery or power up additional vehicle accessories, which results in increasing the efficiency or/and range of the vehicle.
The analytical works resulted in an 8.3% efficiency increasing in the case of the FTP_Highway driving cycle and three micro wind turbines turbine work with Betz efficiency. In terms of range analysis, 16km of range added to the full battery charge range of the vehicle A detailed CFD model with Ansys Fluent, Solidworks and SimScale solvers has been implemented on a sample electric vehicle (Kia Soul) using MRF and sliding mesh methods to act as a virtual wind tunnel.
The optimum place for the turbines to be installed has been clarified. The micro wind turbine has been designed from scratch using Qblade and XFoil solvers by testing many foils section and blade parameter to the best design for the vehicle speed range. After using the designed turbine numerical results and implement them into MATLAB, the results become more accurate. With five micro wind turbines installed at the optimum place, the vehicle efficiency increased by 13.1% at the same driving cycle, and its range increased by 24km on the full charge. Nozzle lense has been designed, tested numerically and added to the system to enhance its performance. The efficiency increased by 25% to reach100% at the best scenario, as mentioned in section 7.2. Finally, the analytical and numerical errors, points of strength and weaknesses in each method and model has been determined to verify the entire work.
MATLAB/SIMULINK MODEL
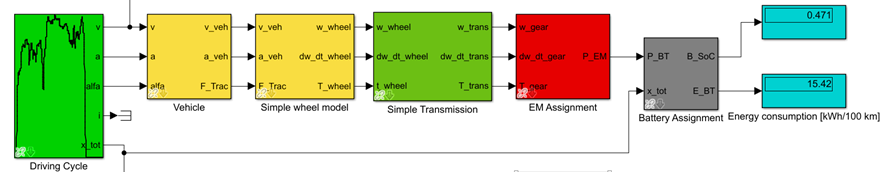
The vehicle has been modelled using MATLAB/SIMULINK software to investigate the vehicle power consumption and the state of charge of the battery after the end of the driving cycle based on many parameters, QSS toolbox has been used to build up the model with same parameters as KIA Soul 2019 as shown in the figure below.
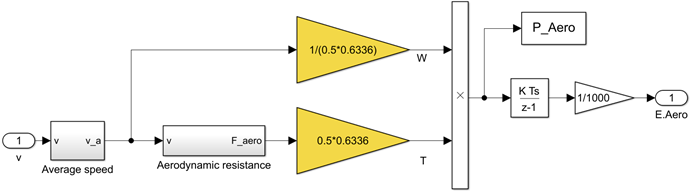
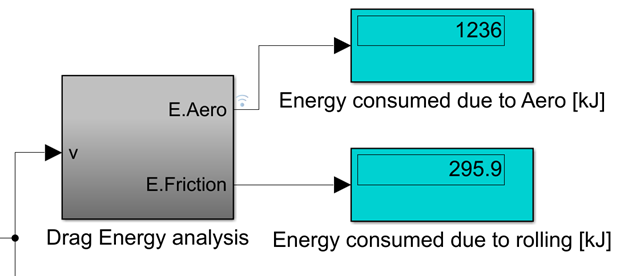
As known and mentioned before in electric vehicles, the main interest is about the vehicle's range or the total distance that the vehicle can cruise with one charge, so any limitation losses must be considered and tried to reduce to improve the ranging performance of the vehicle. One of this research's main objectives is to study the micro wind turbine technology's ability and effectiveness as a range extender in the electric vehicle. Drag utilization model has been conducted and built from scrach to calculate the energy loss due to drag, effeciency and range of the vehicle at each case ans scenario as shown in figures below.
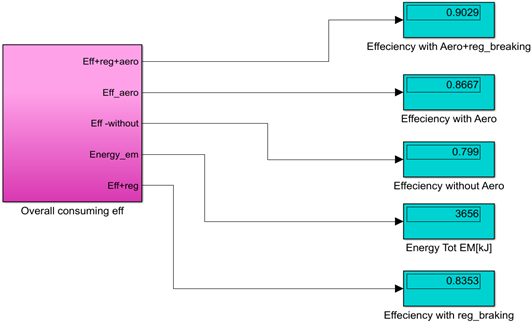
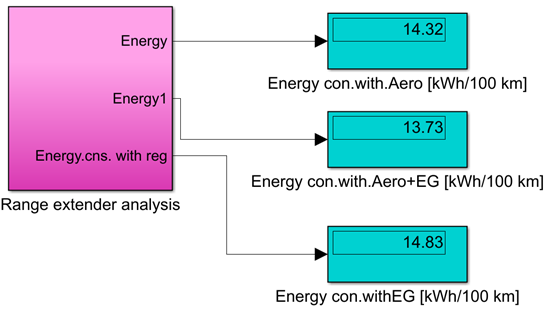
The highest amount of efficiency increasing is at highway driving cycle. The efficiency increases by about 6.7% before and after utilising the drag energy, where the regenerative energy is its least amount. On the other hand, there is a significant contribution from generative braking at both NEDC and RTS95 cycles where the efficiency increases 9.5% and 14.21%, respectively.
| Vehicle Efficiency | NEDC | RTS 95 | FTP_Highway |
| Basic Case (Without Reg. And Drag) | 79.3% | 79.96% | 79.9% |
| Case of Adding 20% Drag Energy | 83.24% | 80.77% | 86.6% |
| Case of Adding Regenerative Energy | 88.8% | 94.17% | 83.53% |
| Case of Adding Both | 92.6% | 95.18% | 90.29% |
| Percentage of Vehicle Efficiency Increasing | NEDC | RTS 95 | FTP_Highway |
| Case of Adding 20%Drag Energy | 4.96% | 1% | 9.26% |
| Case of Adding Regenerative Energy | 10.69% | 15.1% | 4.34% |
| Case of Adding Both | 14.36% | 84% | 11.5% |
| Case | NEDC | RTS 95 | FTP_Highway |
| Basic | 237km | 151km | 194km |
| Case of Adding 20%Drag Energy | 248km | 153km | 210km |
| Case of Adding Regenerative Energy | 267km | 198km | 202km |
| Case of Adding Both | 281.7km | 202km | 218km |
It can be shown from Tables how drag energy can be utilised most efficiently in the highway driving cycle. Where the generative braking energy is at its least amount, and vehicle velocity is always high. That makes it possible to get the benefits from all driving scenarios and generate energy in all situations. The final analytical results indicate that the vehicle range can be increased by 8.2% if the driving is pure highway driving.
Electric Vehicle Aerodynamic Analysis
To validate the CFD simulation results 2D external flow simulation has been done using Ansuys Fluent as a first step. The relative error was 60% which enforced us to conduct a detailed 3D CFD analysis
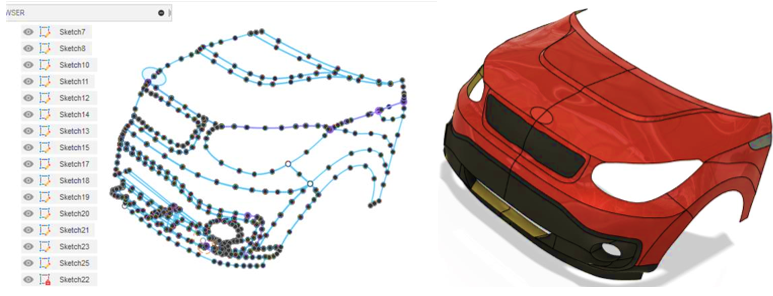
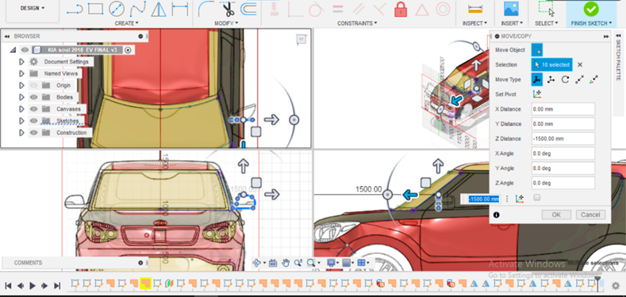
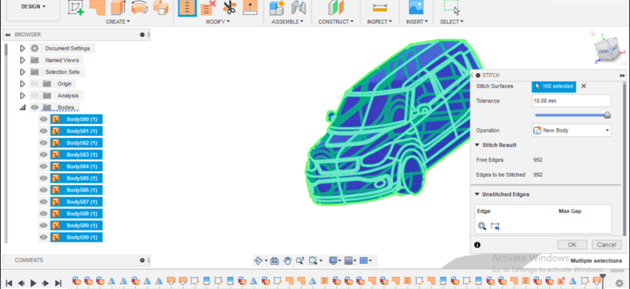
The car geometry has been done using surfacing features provided on Fusion360 workflow to convert the car blueprint into 168 body which stitched to be a single-car body after spending almost fifty hours working on it by doing more than 90 sketches, as Figures show.
| Solver Type | CdNum | Relative Error with(Cdact =0.35) |
| Two dimensional FLUENT | 0.56 | 60% |
| Three dimensional Solidworks | 0.342 | 2.28% |
| Three dimensional Simscale | 0.361 | 3.14% |
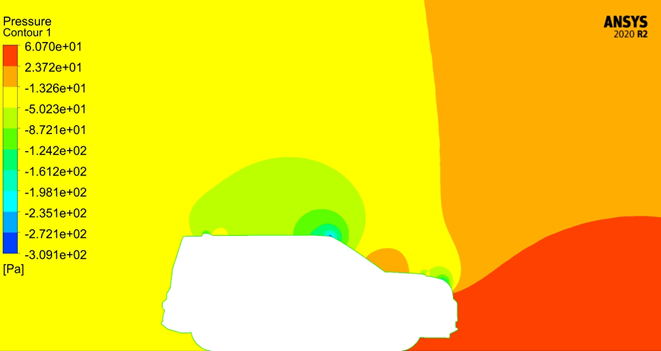
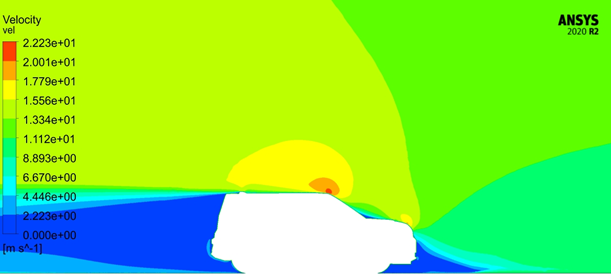
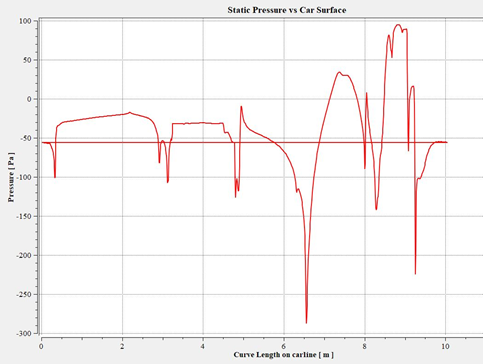
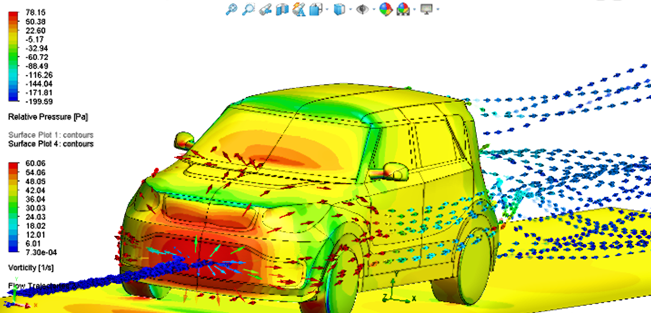
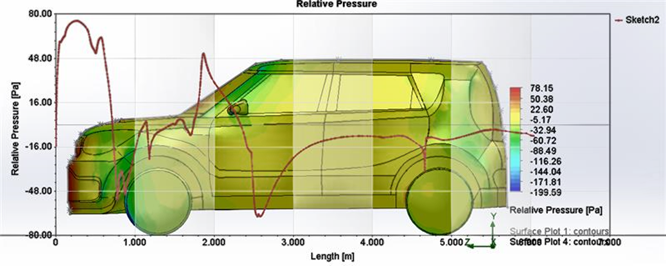
The geometry analysis results indicate the high-pressure area as expected. The frontal bumper area has the highest pressure concentration and stagnation points. Figures illustrate the pressure value of 478.8 pa at a car speed of 100km/hr. which is a subsequent amount of pressure to rotate the small wind turbine. Based on these results, more than one wind turbine can be installed to utilize the whole high pressure area. Considering that there are many designs limitations, one is the flow turbulence after the wind turbine that must be oriented to a unique channel to convert it from turbulent into a laminar flow.
Aerodynamic Analysis for Micro Wind Turbine
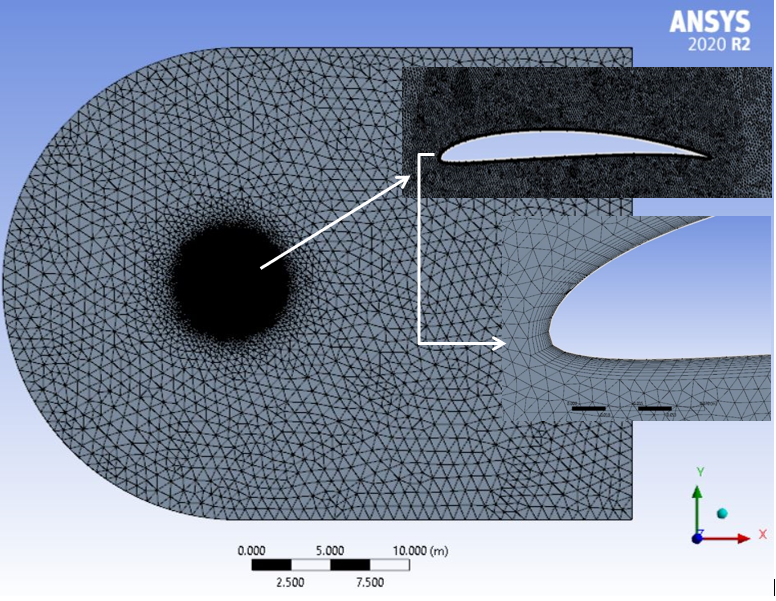
| Structured Mesh | Unstructured Mesh | Error(Structured)% | Error (Unstructured)% | |
| Cl | 1.03324 | 0.96431 | 8.757 | 1.5 |
| Cd | 0.059864 | 0.05048 | 37 | 16.0 |
| Cl/Cd | 17.259 | 19.1 | 20.465 | 11.981 |
| Lift Force[N] | 224 | 270.5 | - | - |
| Drag Force[N] | 16.791 | 14.15 | - | - |
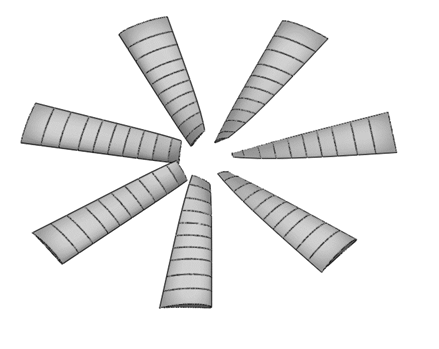
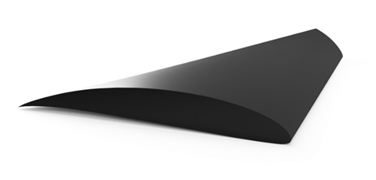
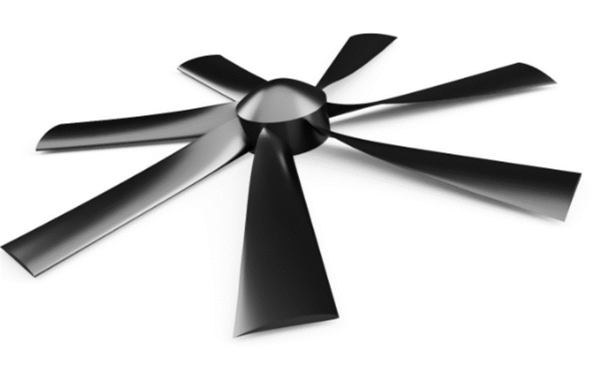
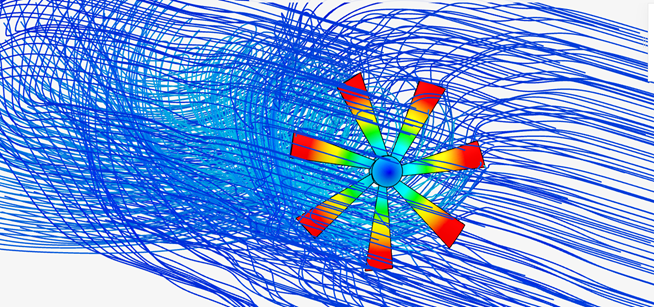
Blade Model in Q-Blade
Simscale and SolidWorks MRF CFD Simulation
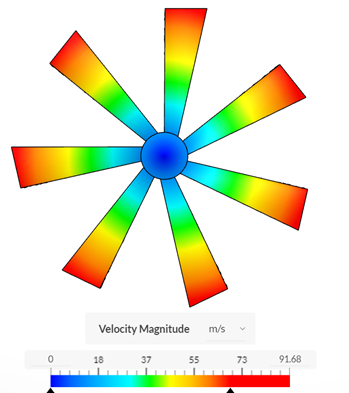
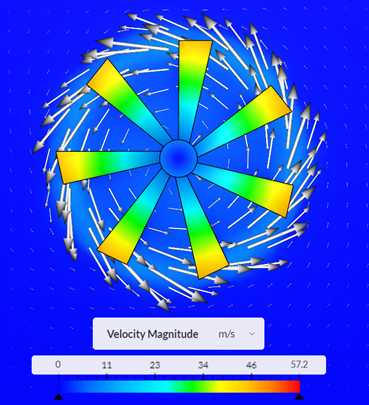
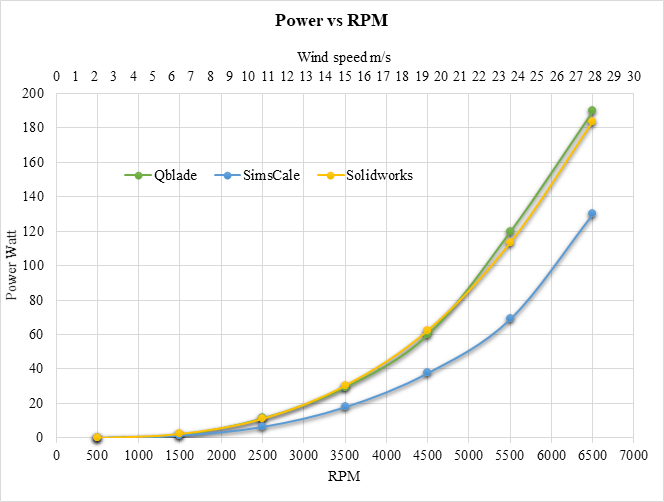
It can be seen from trhe Figure that the Solidworks results are very similar to Qblade results with an average relative error of 2.19%. SimScale has an identical plot compared to Qblade results but with a higher relative error of 36.3%. The error is minimal at low-speed value for SimScale solver, but it significantly increased at higher velocities.
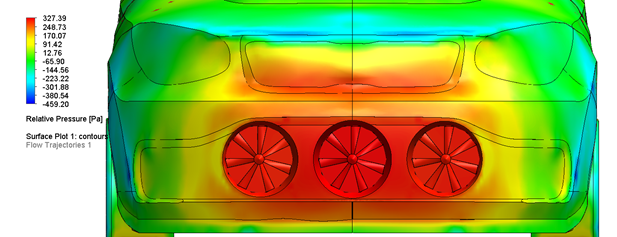
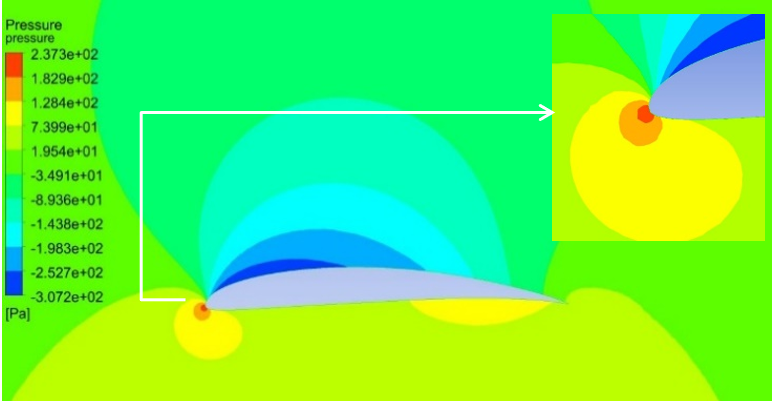
After adding the wind turbines model to the car’s front, the CFD analysis has been repeated to investigate the pressure profile. The analysis has been done without assuming a rotating zoon or sliding mesh, which means that the wind turbines are assumed to be stationary while the car is moving. The maximum pressure is 3279a, which is interestingly less than the value before adding the turbine, as shown in Figure . The drag coefficient calculated to be 0.39 with 316N of drag force, which is 2.63% higher than the original value.
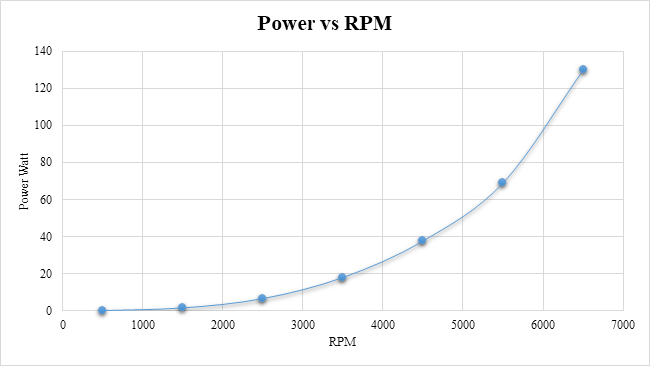
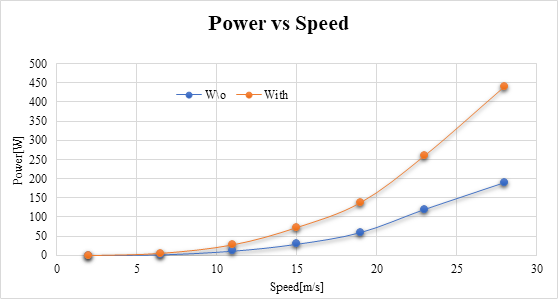
Power Produced at Various Speed After Adding the Nozzle Based on Qblade Results
| Rotational speed[rpm] | Power W\o[W] | SpeedW\o[m/s] | Cp W\o | Power withNozzle | Cp withNozzle | Eff. (η) WithNozzle | Eff w/oNozzle |
| 3500 | 29.5 | 15 | 0.290 | 73 | 0.719 | 0.424 | 0.1715 |
| 4500 | 60 | 19 | 0.290 | 138 | 0.669 | 0.394 | 0.171 |
| 5500 | 120 | 23 | 0.328 | 260 | 0.711 | 0.419 | 0.194 |
| 6500 | 190 | 28 | 0.288 | 440 | 0.667 | 0.393 | 0.1698 |
| Average value | 99.87 | 21.25 | 0.299 | 227.75 | 0.691 | 0.407 | 0.176 |
Final Results for Both Cases (With and without Nozzle)
It can be seen from Table below the contribution of the nozzle to the final efficiency and range values. Based on the real-time MATLAB model, the vehicle’s efficiency increases by 13.13% after adding the turbine without adding the nozzle. And the vehicle range increased by 13%. After adding the nozzle, the energy generated increased by 29.7%, which is 126% higher than the efficiency without wind turbines. The range increased by 69km per charge, which represents 33.5% of the original vehicle’s range(190km/charge). That is calculated based on the average energy production values with highway driving scenarios.
| Case | Avg Power from Each Turbine[W] | Vehicle Eff. With Turbines | Vehicle Range with Turbine [km/Charge] | Gained Eff. (η) % | Gained Range % |
| Qblade W/o Nozzle | 100 | 90.39% | 219.66 | 13.13% | 13% |
| Qblade With Nozzle | 227.8 | 103.7% | 259.7 | 29.7% | 33.5%, |